Symptom Tracker Template
Symptom Tracker Template
Couldn't load pickup availability
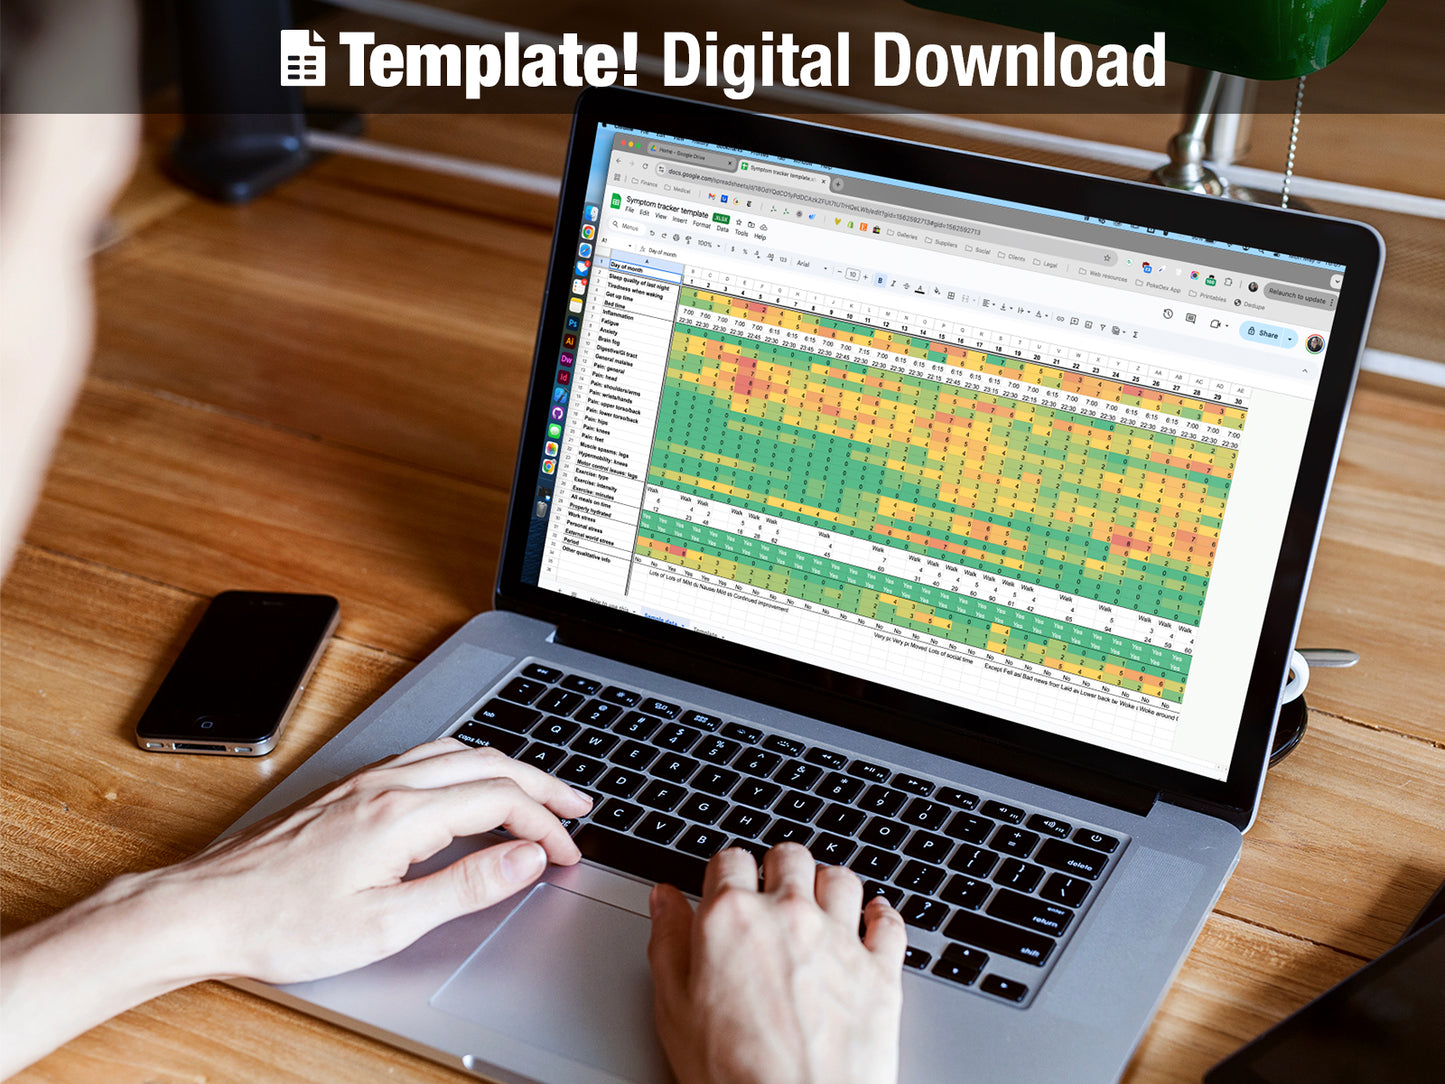
During the summer of 2022, I developed this symptom tracker template while participating in an early-stage health study. The study involved wearing a Fitbit Charge 5 24/7 to collect various metrics including heart rate and blood oxygen levels.
The goal of this phase of the health study was to research long COVID and other chronic fatigue disorders. My data made it to the research team as raw sensor data, which they could visualize using charts and graphics. However, this didn’t give them any context for internal and external factors, including:
- “Rolling the dice” for my chronic illness symptoms. Symptoms are unpredictable, even on good days.
- My own perception of how well and how long I slept
- Environmental factors: weather, humidity, smoke from wildfires, air pressure
- Social factors: gatherings and events that take a significant amount of energy and need a recovery period
- Hydration
- When and what I ate
- Work and personal stressors
Raw data tells one story, but my lived experience provided more complete information for the data analysts.
Devices such as the Fitbit and Apple Watch work fantastically… for most people. People like me often don’t get useful feedback from them. Various sleep disorders (insomnia, light sleep, poor sleep, etc) skew data and I often find myself confused by my reports. How can it say I got seven hours of sleep when I distinctly remember laying awake most of the night? Wrist-based monitors simply don’t collect enough of the correct type of data to accurately measure sleep.
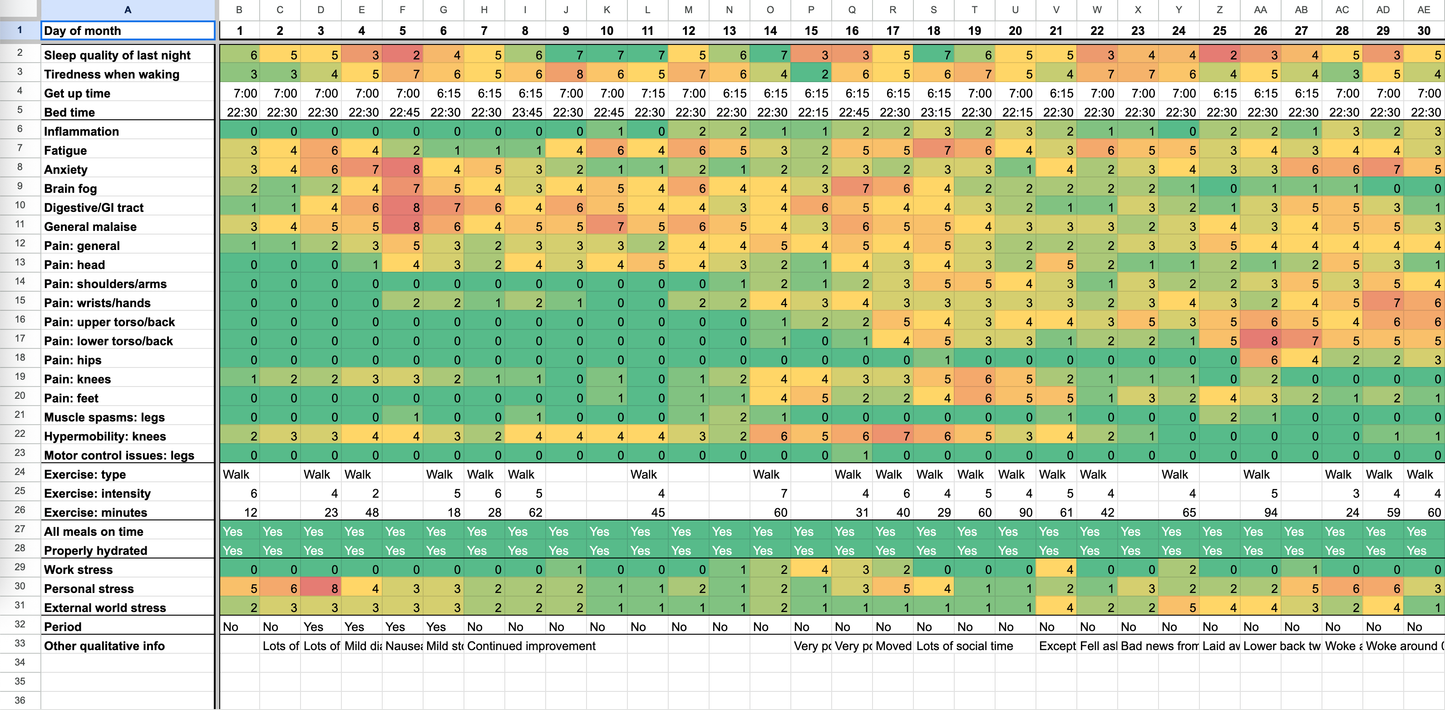
My symptom tracker template allows you to see everything all in one place, and puts equal value on qualitative experience and quantitative data.
This template uses conditional formatting to dynamically color cells based on their value relative to the rest of their row. This allows you to see trends over time within a single metric, as well as relationships between metrics. By assigning colors to values, this creates a heat map of each month's symptoms.
You can easily modify the template to suit your own needs:
- Add or remove rows
- Change colors based on accessibility needs
- Add or remove entire data sets
--
If you like my work and want to support me, please check out my online store or become a patron. Thank you!
--
Licensed for personal use only. Commercial licenses not available for this template. Please do not redistribute this file or any modified derivatives of this file in any way, or sell your own derivatives made from this file. Thank you.
Share